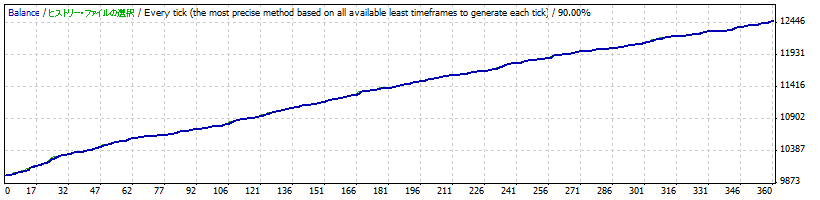
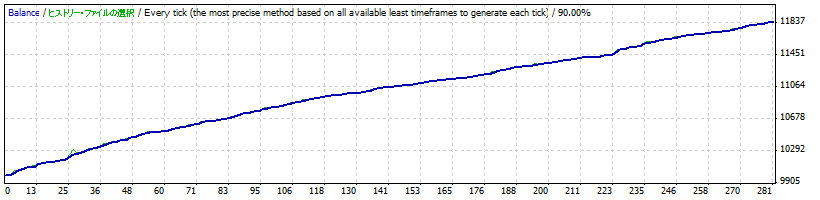
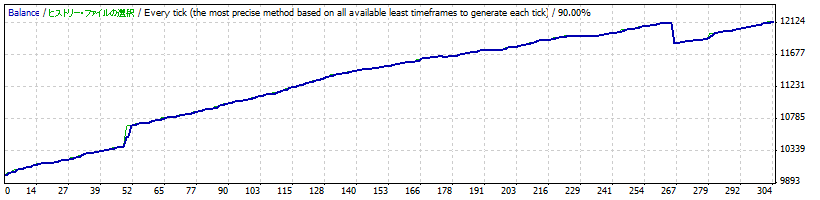
Strategy Tester Report
KILL4XIS.jr 9PAIR
FXDDMalta-MT4 Demo
Server 2 (Build 225)
|
通貨ペア |
USDCAD
( |
||||
|
期間 |
15分足(M15) 2009.01.02 08:00 -
2010.07.05 23:45 (2009.01.01 - 2010.07.06) |
||||
|
モデル |
Every
tick (the most precise method based on all available least timeframes) |
||||
|
パラメーター |
Magic=0;
HourStartTrade=0; HourStopTrade=1;
TakeProfit=15; |
||||
|
|
|
|
|
|
|
|
Bars
in test |
35795 |
Ticks
modelled |
10101250 |
Modelling quality |
90.00% |
|
Mismatched
charts errors |
0 |
|
|
|
|
|
|
|||||
|
Initial
deposit |
10000.00 |
|
|
|
|
|
Total
net profit |
2471.54 |
Gross
profit |
2536.64 |
Gross
loss |
-65.09 |
|
Profit
factor |
38.97 |
Expected
payoff |
6.87 |
|
|
|
Absolute
drawdown |
214.86 |
Maximal
drawdown |
555.01 (5.22%) |
Relative
drawdown |
5.22% (555.01) |
|
|
|||||
|
Total
trades |
360 |
Short
positions (won %) |
220 (93.64%) |
Long
positions (won %) |
140 (95.71%) |
|
|
Profit
trades (% of total) |
340 (94.44%) |
Loss
trades (% of total) |
20 (5.56%) |
|
|
Largest |
profit
trade |
37.63 |
loss
trade |
-4.07 |
|
|
Average |
profit
trade |
7.46 |
loss
trade |
-3.25 |
|
|
Maximum |
consecutive
wins (profit in money) |
80 (626.54) |
consecutive
losses (loss in money) |
2 (-6.96) |
|
|
Maximal |
consecutive
profit (count of wins) |
626.54 (80) |
consecutive
loss (count of losses) |
-6.96 (2) |
|
|
Average |
consecutive
wins |
18 |
consecutive
losses |
1 |
|
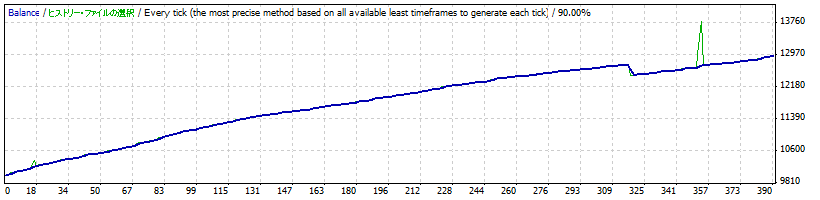
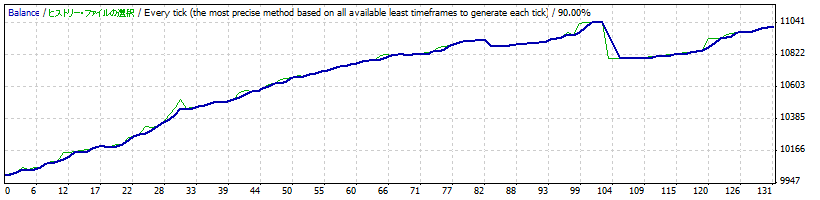
Strategy Tester Report
KILL4XIS.jr 9PAIR
FXDDMalta-MT4 Demo
Server 2 (Build 225)
|
通貨ペア |
EURCAD
(Euro vs. Canadian Dollar) |
||||
|
期間 |
15分足(M15) 2009.01.26 06:30 -
2010.07.05 23:45 (2009.01.01 - 2010.07.06) |
||||
|
モデル |
Every
tick (the most precise method based on all available least timeframes) |
||||
|
パラメーター |
Magic=0;
HourStartTrade=0; HourStopTrade=1;
TakeProfit=15; |
||||
|
|
|
|
|
|
|
|
Bars
in test |
32051 |
Ticks
modelled |
18586537 |
Modelling quality |
90.00% |
|
Mismatched
charts errors |
0 |
|
|
|
|
|
|
|||||
|
Initial
deposit |
10000.00 |
|
|
|
|
|
Total
net profit |
2936.70 |
Gross
profit |
3237.96 |
Gross
loss |
-301.27 |
|
Profit
factor |
10.75 |
Expected
payoff |
7.55 |
|
|
|
Absolute
drawdown |
51.89 |
Maximal
drawdown |
433.26 (3.40%) |
Relative
drawdown |
3.40% (433.26) |
|
|
|||||
|
Total
trades |
389 |
Short
positions (won %) |
235 (97.02%) |
Long
positions (won %) |
154 (91.56%) |
|
|
Profit
trades (% of total) |
369 (94.86%) |
Loss
trades (% of total) |
20 (5.14%) |
|
|
Largest |
profit
trade |
25.47 |
loss
trade |
-100.44 |
|
|
Average |
profit
trade |
8.77 |
loss
trade |
-15.06 |
|
|
Maximum |
consecutive
wins (profit in money) |
119 (1191.75) |
consecutive
losses (loss in money) |
3 (-245.80) |
|
|
Maximal |
consecutive
profit (count of wins) |
1191.75 (119) |
consecutive
loss (count of losses) |
-245.80 (3) |
|
|
Average |
consecutive
wins |
19 |
consecutive
losses |
1 |
|
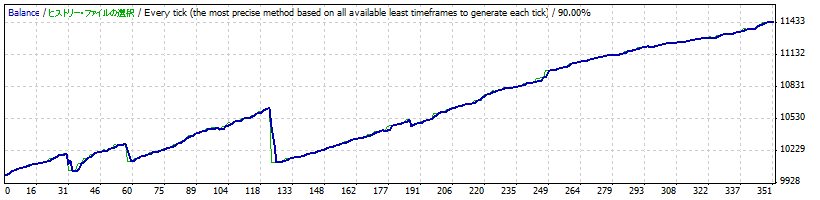
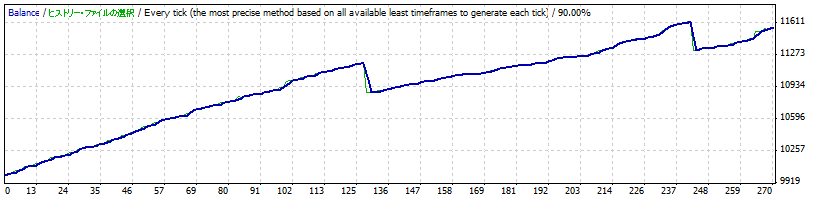
Strategy Tester Report
KILL4XIS.jr 9PAIR
FXDDMalta-MT4 Demo
Server 2 (Build 225)
|
通貨ペア |
AUDCAD
(Australian Dollar vs. Canadian Dollar) |
||||
|
期間 |
15分足(M15) 2009.01.26 05:30 -
2010.07.05 23:45 (2009.01.01 - 2010.07.06) |
||||
|
モデル |
Every
tick (the most precise method based on all available least timeframes) |
||||
|
パラメーター |
Magic=0;
HourStartTrade=0; HourStopTrade=1;
TakeProfit=15; |
||||
|
|
|
|
|
|
|
|
Bars
in test |
32002 |
Ticks
modelled |
15352988 |
Modelling quality |
90.00% |
|
Mismatched
charts errors |
0 |
|
|
|
|
|
|
|||||
|
Initial
deposit |
10000.00 |
|
|
|
|
|
Total
net profit |
1448.56 |
Gross
profit |
2490.55 |
Gross
loss |
-1041.99 |
|
Profit
factor |
2.39 |
Expected
payoff |
4.13 |
|
|
|
Absolute
drawdown |
320.50 |
Maximal
drawdown |
592.99 (5.57%) |
Relative
drawdown |
5.73% (588.55) |
|
|
|||||
|
Total
trades |
351 |
Short
positions (won %) |
219 (89.50%) |
Long
positions (won %) |
132 (87.12%) |
|
|
Profit
trades (% of total) |
311 (88.60%) |
Loss
trades (% of total) |
40 (11.40%) |
|
|
Largest |
profit
trade |
50.98 |
loss
trade |
-172.82 |
|
|
Average |
profit
trade |
8.01 |
loss
trade |
-26.05 |
|
|
Maximum |
consecutive
wins (profit in money) |
28 (181.20) |
consecutive
losses (loss in money) |
4 (-510.88) |
|
|
Maximal |
consecutive
profit (count of wins) |
246.57 (20) |
consecutive
loss (count of losses) |
-510.88 (4) |
|
|
Average |
consecutive
wins |
10 |
consecutive
losses |
1 |
|
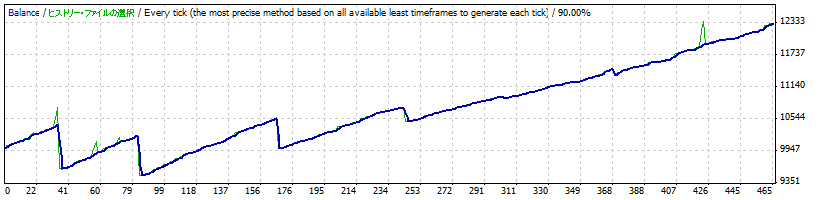
Strategy Tester Report
KILL4XIS.jr 9PAIR
FXDDMalta-MT4 Demo
Server 2 (Build 225)
|
通貨ペア |
EURCHF
(Euro vs. Swiss Franc) |
||||
|
期間 |
15分足(M15) 2009.01.02 08:00 -
2010.07.05 23:45 (2009.01.01 - 2010.07.06) |
||||
|
モデル |
Every
tick (the most precise method based on all available least timeframes) |
||||
|
パラメーター |
Magic=0;
HourStartTrade=0; HourStopTrade=1;
TakeProfit=15; |
||||
|
|
|
|
|
|
|
|
Bars
in test |
33612 |
Ticks
modelled |
12458352 |
Modelling quality |
90.00% |
|
Mismatched
charts errors |
0 |
|
|
|
|
|
|
|||||
|
Initial
deposit |
10000.00 |
|
|
|
|
|
Total
net profit |
1326.43 |
Gross
profit |
1426.29 |
Gross
loss |
-99.86 |
|
Profit
factor |
14.28 |
Expected
payoff |
8.29 |
|
|
|
Absolute
drawdown |
130.69 |
Maximal
drawdown |
203.11 (1.96%) |
Relative
drawdown |
1.96% (203.11) |
|
|
|||||
|
Total
trades |
160 |
Short
positions (won %) |
101 (90.10%) |
Long
positions (won %) |
59 (94.92%) |
|
|
Profit
trades (% of total) |
147 (91.88%) |
Loss
trades (% of total) |
13 (8.13%) |
|
|
Largest |
profit
trade |
94.08 |
loss
trade |
-33.00 |
|
|
Average |
profit
trade |
9.70 |
loss
trade |
-7.68 |
|
|
Maximum |
consecutive
wins (profit in money) |
59 (431.40) |
consecutive
losses (loss in money) |
3 (-64.03) |
|
|
Maximal |
consecutive
profit (count of wins) |
491.80 (30) |
consecutive
loss (count of losses) |
-64.03 (3) |
|
|
Average |
consecutive
wins |
13 |
consecutive
losses |
1 |
|
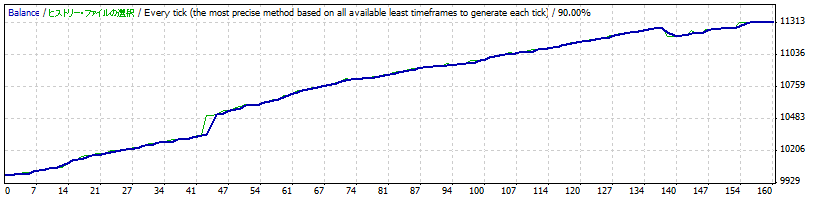
Strategy Tester Report
KILL4XIS.jr 9PAIR
FXDDMalta-MT4 Demo
Server 2 (Build 225)
|
通貨ペア |
USDCHF
( |
||||
|
期間 |
15分足(M15) 2009.01.02 08:00 -
2010.07.05 23:45 (2009.01.01 - 2010.07.06) |
||||
|
モデル |
Every
tick (the most precise method based on all available least timeframes) |
||||
|
パラメーター |
Magic=0;
HourStartTrade=0; HourStopTrade=1;
TakeProfit=15; |
||||
|
|
|
|
|
|
|
|
Bars
in test |
33592 |
Ticks
modelled |
13278767 |
Modelling quality |
90.00% |
|
Mismatched
charts errors |
0 |
|
|
|
|
|
|
|||||
|
Initial
deposit |
10000.00 |
|
|
|
|
|
Total
net profit |
1856.71 |
Gross
profit |
1885.97 |
Gross
loss |
-29.26 |
|
Profit
factor |
64.47 |
Expected
payoff |
6.61 |
|
|
|
Absolute
drawdown |
19.75 |
Maximal
drawdown |
375.40 (3.56%) |
Relative
drawdown |
3.56% (375.40) |
|
|
|||||
|
Total
trades |
281 |
Short
positions (won %) |
174 (97.13%) |
Long
positions (won %) |
107 (95.33%) |
|
|
Profit
trades (% of total) |
271 (96.44%) |
Loss
trades (% of total) |
10 (3.56%) |
|
|
Largest |
profit
trade |
26.26 |
loss
trade |
-3.94 |
|
|
Average |
profit
trade |
6.96 |
loss
trade |
-2.93 |
|
|
Maximum |
consecutive
wins (profit in money) |
53 (523.65) |
consecutive
losses (loss in money) |
1 (-3.94) |
|
|
Maximal |
consecutive
profit (count of wins) |
523.65 (53) |
consecutive
loss (count of losses) |
-3.94 (1) |
|
|
Average |
consecutive
wins |
27 |
consecutive
losses |
1 |
|
Strategy Tester Report
KILL4XIS.jr 9PAIR
FXDDMalta-MT4 Demo
Server 2 (Build 225)
|
通貨ペア |
EURGBP
(Euro vs. |
||||
|
期間 |
15分足(M15) 2009.01.02 08:00 -
2010.06.29 23:45 (2009.01.01 - 2010.06.30) |
||||
|
モデル |
Every
tick (the most precise method based on all available least timeframes) |
||||
|
パラメーター |
Magic=0;
HourStartTrade=0; HourStopTrade=1;
TakeProfit=15; |
||||
|
|
|
|
|
|
|
|
Bars
in test |
34889 |
Ticks
modelled |
14219862 |
Modelling quality |
90.00% |
|
Mismatched
charts errors |
0 |
|
|
|
|
|
|
|||||
|
Initial
deposit |
10000.00 |
|
|
|
|
|
Total
net profit |
1013.62 |
Gross
profit |
1382.59 |
Gross
loss |
-368.97 |
|
Profit
factor |
3.75 |
Expected
payoff |
7.74 |
|
|
|
Absolute
drawdown |
112.31 |
Maximal
drawdown |
928.64 (8.40%) |
Relative
drawdown |
8.40% (928.64) |
|
|
|||||
|
Total
trades |
131 |
Short
positions (won %) |
73 (80.82%) |
Long
positions (won %) |
58 (93.10%) |
|
|
Profit
trades (% of total) |
113 (86.26%) |
Loss
trades (% of total) |
18 (13.74%) |
|
|
Largest |
profit
trade |
42.34 |
loss
trade |
-88.01 |
|
|
Average |
profit
trade |
12.24 |
loss
trade |
-20.50 |
|
|
Maximum |
consecutive
wins (profit in money) |
25 (253.38) |
consecutive
losses (loss in money) |
4 (-251.89) |
|
|
Maximal |
consecutive
profit (count of wins) |
264.79 (12) |
consecutive
loss (count of losses) |
-251.89 (4) |
|
|
Average |
consecutive
wins |
7 |
consecutive
losses |
1 |
|
Strategy Tester Report
KILL4XIS.jr 9PAIR
FXDDMalta-MT4 Demo
Server 2 (Build 225)
|
通貨ペア |
CHFJPY
(Swiss Franc vs. Japanese Yen) |
||||
|
期間 |
15分足(M15) 2009.01.26 06:15 -
2010.07.05 23:45 (2009.01.01 - 2010.07.06) |
||||
|
モデル |
Every
tick (the most precise method based on all available least timeframes) |
||||
|
パラメーター |
Magic=0;
HourStartTrade=0; HourStopTrade=1;
TakeProfit=15; |
||||
|
|
|
|
|
|
|
|
Bars
in test |
32058 |
Ticks
modelled |
17020998 |
Modelling quality |
90.00% |
|
Mismatched
charts errors |
0 |
|
|
|
|
|
|
|||||
|
Initial
deposit |
10000.00 |
|
|
|
|
|
Total
net profit |
1560.32 |
Gross
profit |
2228.89 |
Gross
loss |
-668.57 |
|
Profit
factor |
3.33 |
Expected
payoff |
5.78 |
|
|
|
Absolute
drawdown |
183.24 |
Maximal
drawdown |
448.88 (3.86%) |
Relative
drawdown |
4.00% (447.84) |
|
|
|||||
|
Total
trades |
270 |
Short
positions (won %) |
176 (91.48%) |
Long
positions (won %) |
94 (92.55%) |
|
|
Profit
trades (% of total) |
248 (91.85%) |
Loss
trades (% of total) |
22 (8.15%) |
|
|
Largest |
profit
trade |
29.57 |
loss
trade |
-155.02 |
|
|
Average |
profit
trade |
8.99 |
loss
trade |
-30.39 |
|
|
Maximum |
consecutive
wins (profit in money) |
37 (325.50) |
consecutive
losses (loss in money) |
3 (-307.73) |
|
|
Maximal |
consecutive
profit (count of wins) |
325.50 (37) |
consecutive
loss (count of losses) |
-307.73 (3) |
|
|
Average |
consecutive
wins |
13 |
consecutive
losses |
1 |
|
Strategy Tester Report
KILL4XIS.jr 9PAIR
FXDDMalta-MT4 Demo
Server 2 (Build 225)
|
通貨ペア |
EURJPY
(Euro vs. Japanese Yen) |
||||
|
期間 |
15分足(M15) 2009.01.02 08:00 -
2010.07.05 23:45 (2009.01.01 - 2010.07.06) |
||||
|
モデル |
Every
tick (the most precise method based on all available least timeframes) |
||||
|
パラメーター |
Magic=0;
HourStartTrade=0; HourStopTrade=1;
TakeProfit=15; |
||||
|
|
|
|
|
|
|
|
Bars
in test |
33415 |
Ticks
modelled |
21306679 |
Modelling quality |
90.00% |
|
Mismatched
charts errors |
1 |
|
|
|
|
|
|
|||||
|
Initial
deposit |
10000.00 |
|
|
|
|
|
Total
net profit |
2325.47 |
Gross
profit |
4869.43 |
Gross
loss |
-2543.97 |
|
Profit
factor |
1.91 |
Expected
payoff |
5.01 |
|
|
|
Absolute
drawdown |
562.85 |
Maximal
drawdown |
1028.27 (9.83%) |
Relative
drawdown |
9.83% (1028.27) |
|
|
|||||
|
Total
trades |
464 |
Short
positions (won %) |
265 (93.96%) |
Long
positions (won %) |
199 (92.46%) |
|
|
Profit
trades (% of total) |
433 (93.32%) |
Loss
trades (% of total) |
31 (6.68%) |
|
|
Largest |
profit
trade |
31.85 |
loss
trade |
-284.38 |
|
|
Average |
profit
trade |
11.25 |
loss
trade |
-82.06 |
|
|
Maximum |
consecutive
wins (profit in money) |
81 (1050.49) |
consecutive
losses (loss in money) |
3 (-837.22) |
|
|
Maximal |
consecutive
profit (count of wins) |
1050.49 (81) |
consecutive
loss (count of losses) |
-837.22 (3) |
|
|
Average |
consecutive
wins |
18 |
consecutive
losses |
1 |
|
Strategy Tester Report
KILL4XIS.jr 9PAIR
FXDDMalta-MT4 Demo
Server 2 (Build 225)
|
通貨ペア |
CADJPY
(Canadian Dollar vs. Japanese Yen) |
||||
|
期間 |
15分足(M15) 2009.01.26 06:00 -
2010.07.05 23:45 (2009.01.01 - 2010.07.06) |
||||
|
モデル |
Every
tick (the most precise method based on all available least timeframes) |
||||
|
パラメーター |
Magic=0;
HourStartTrade=0; HourStopTrade=1;
TakeProfit=15; |
||||
|
|
|
|
|
|
|
|
Bars
in test |
33765 |
Ticks
modelled |
15910095 |
Modelling quality |
90.00% |
|
Mismatched
charts errors |
0 |
|
|
|
|
|
|
|||||
|
Initial
deposit |
10000.00 |
|
|
|
|
|
Total
net profit |
2141.40 |
Gross
profit |
2534.49 |
Gross
loss |
-393.09 |
|
Profit
factor |
6.45 |
Expected
payoff |
7.04 |
|
|
|
Absolute
drawdown |
335.63 |
Maximal
drawdown |
501.69 (4.93%) |
Relative
drawdown |
4.93% (501.69) |
|
|
|||||
|
Total
trades |
304 |
Short
positions (won %) |
206 (91.26%) |
Long
positions (won %) |
98 (91.84%) |
|
|
Profit
trades (% of total) |
278 (91.45%) |
Loss
trades (% of total) |
26 (8.55%) |
|
|
Largest |
profit
trade |
150.17 |
loss
trade |
-279.77 |
|
|
Average |
profit
trade |
9.12 |
loss
trade |
-15.12 |
|
|
Maximum |
consecutive
wins (profit in money) |
86 (753.24) |
consecutive
losses (loss in money) |
2 (-9.46) |
|
|
Maximal |
consecutive
profit (count of wins) |
753.24 (86) |
consecutive
loss (count of losses) |
-279.77 (1) |
|
|
Average |
consecutive
wins |
11 |
consecutive
losses |
1 |
|
MT4 EA へ戻る